
Most companies know when something has already gone wrong. Sales drop, stock piles up, customer complaints spike, or a team misses a target by a wide margin. By then, the business is hearing a fire alarm. The harder work is finding the smoke while it is still thin. That is why a data analytics service provider can matter so much: good analytics traces the first small signals that led to the damage.
Table of Contents
ToggleA fire alarm is useful, of course, because nobody wants to miss the warning. However, a company that only reacts to alarms spends too much time cleaning up messes. Stronger competitors get better at spotting pressure before it turns into a public problem. The difference is not just better dashboards. It is better memory, better sequence, and better questions.
Surface symptoms are easy to notice because they arrive with noise: a support queue gets longer, a warehouse runs behind, a product line loses margin, and a campaign brings clicks but not buyers. Each issue may look separate, so each department starts fixing the part it can see.
That is where many businesses get stuck. Sales may blame weak demand. Supply may blame delayed inputs. Finance may blame discounting. Product may blame poor positioning. Everyone may be partly right, which makes the full answer harder to see. The real story sits in the gaps between teams.
Strong analytics connects those gaps. It asks what changed first, what changed next, and what changed only after other numbers had already moved. Thus, the business stops treating every visible problem like a fresh surprise. A drop in repeat purchases may not begin with pricing. It may begin with slower delivery, then weaker reviews, then smaller basket sizes, then fewer renewals. The final number screams, but the first signal barely speaks.
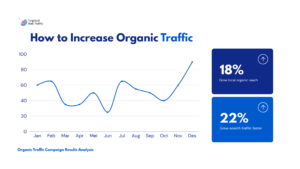
This is why a skilled data analytics company must look beyond neat charts. A chart can show that revenue fell in April. It takes deeper work to show that the fall began with missed service times in one region, followed by lower reorder rates among customers who buy again within 30 days.
A snapshot tells a business where it stands, while a timeline tells how it got there. That difference matters because most problems do not appear fully formed. They build like a crack in a windshield: small at first, easy to ignore, then suddenly across the whole view.
Good analytics treats time as evidence. It looks at the order of events, not only the size of the final result. Therefore, it can separate a real warning from a random wobble. One slow week may mean nothing. Three slow weeks after a pricing change, in the same customer group, with a rise in abandoned carts, may mean something specific.
The same idea appears in early-warning systems, where the value comes from spotting weak signals before leaders are forced into rushed choices. In business analytics, that means asking when a measure first drifted away from normal, which teams touched the process, and whether other measures moved in the same direction.
A useful early warning setup may track:
This list is not a generic reporting menu. It shows where the first heat came from and where the team still has time to stop it.
Dashboards can become polished smoke detectors with dead batteries. They may look clean while missing the messy truth underneath. A weekly sales dashboard may not include service delays, while a finance dashboard may not show the product issue that forced discounts.
Moreover, dashboards are usually built around familiar questions:
Those questions matter, but real warnings answer stranger questions:
This is where outside analytics helps. An external team has less attachment to the old report pack. Companies like N-iX, for example, connect data analytics services with planning, engineering, and business use cases, so scattered measures can become patterns people can act on.
The point is not to drown the company in more charts. It is to reduce the number of charts that argue with each other. When every team brings a different version of the truth, leaders waste energy choosing which number feels right.
A weak warning says, “Something is wrong.” A useful warning says, “Something started to change here, around this time, among these customers, after this process changed.” That second version gives people room to act earlier.
That is why methods like anomaly detection can be useful when they are tied to real business context. The tool may flag an unusual pattern, but people still need to understand whether it matters. A sudden jump in orders may be good news, fraud, a campaign effect, a stock error, or a seasonal bump.
That outside view is especially useful when comparing data analytics companies. The best fit is not always the team with the flashiest demo. It is the team that can understand the business process, challenge weak measures, and explain findings in language that sales, finance, product, and operations can all understand. Professional analytics agencies, such as N-iX, can be part of that kind of work when scattered signals need to become a practical early warning structure.
Businesses do not need more alarms for problems that have already become obvious. They require earlier, clearer notice of the small changes that lead to those issues. Strong analytics connects symptoms to causes, places events in order, and shows where action can still make a difference. It turns dashboards from scoreboards into storylines.